Seismic Hazard Microzonation Map for the Central Plain of Thailand
Abstract
A study was conducted to investigate the seismic hazard microzonation of the central plain of Thailand, which is situated in an area with a thick quaternary basin. Unconsolidated sediments can lead to amplification of earthquake ground shaking at fundamental frequency and can cause a significant increase in damage to buildings. The research yielded significant results, including the development of a fundamental frequency map through the analysis of HVSR for 149 microtremor measurement sites. Subsequently, a Vs30 map was derived utilizing HVSR inversion techniques, and a soil classification map was constructed based on the NEHRP classification. The upper central plain along the Yom River and the Nan River had a low fundamental frequency of 0.3-0.5 Hz and low Vs30, which can be classified as soil type Class E. In the southern areas of Ayutthaya, Pathum Thani, and central Bangkok, an extremely low Vs30 of less than 100 m/s was observed, indicating soil class F or special soft soil. A comprehensive investigation was conducted on probabilistic seismic hazard analysis by considering the Vs30 sites condition for PGA, SA0.2s, and SA1.0s with a 2475-year return period. The northern region of the upper central plain and the western side of the central basin exhibit relatively high seismic hazards. Furthermore, the site effect significantly amplifies ground motion at the 1.0 second period, surpassing the earthquake-resistant design standard for buildings in Thailand by more than 5 times, particularly in the central region of the lower central plain.
DOI: https://doi.org/10.60101/past.2024.251551
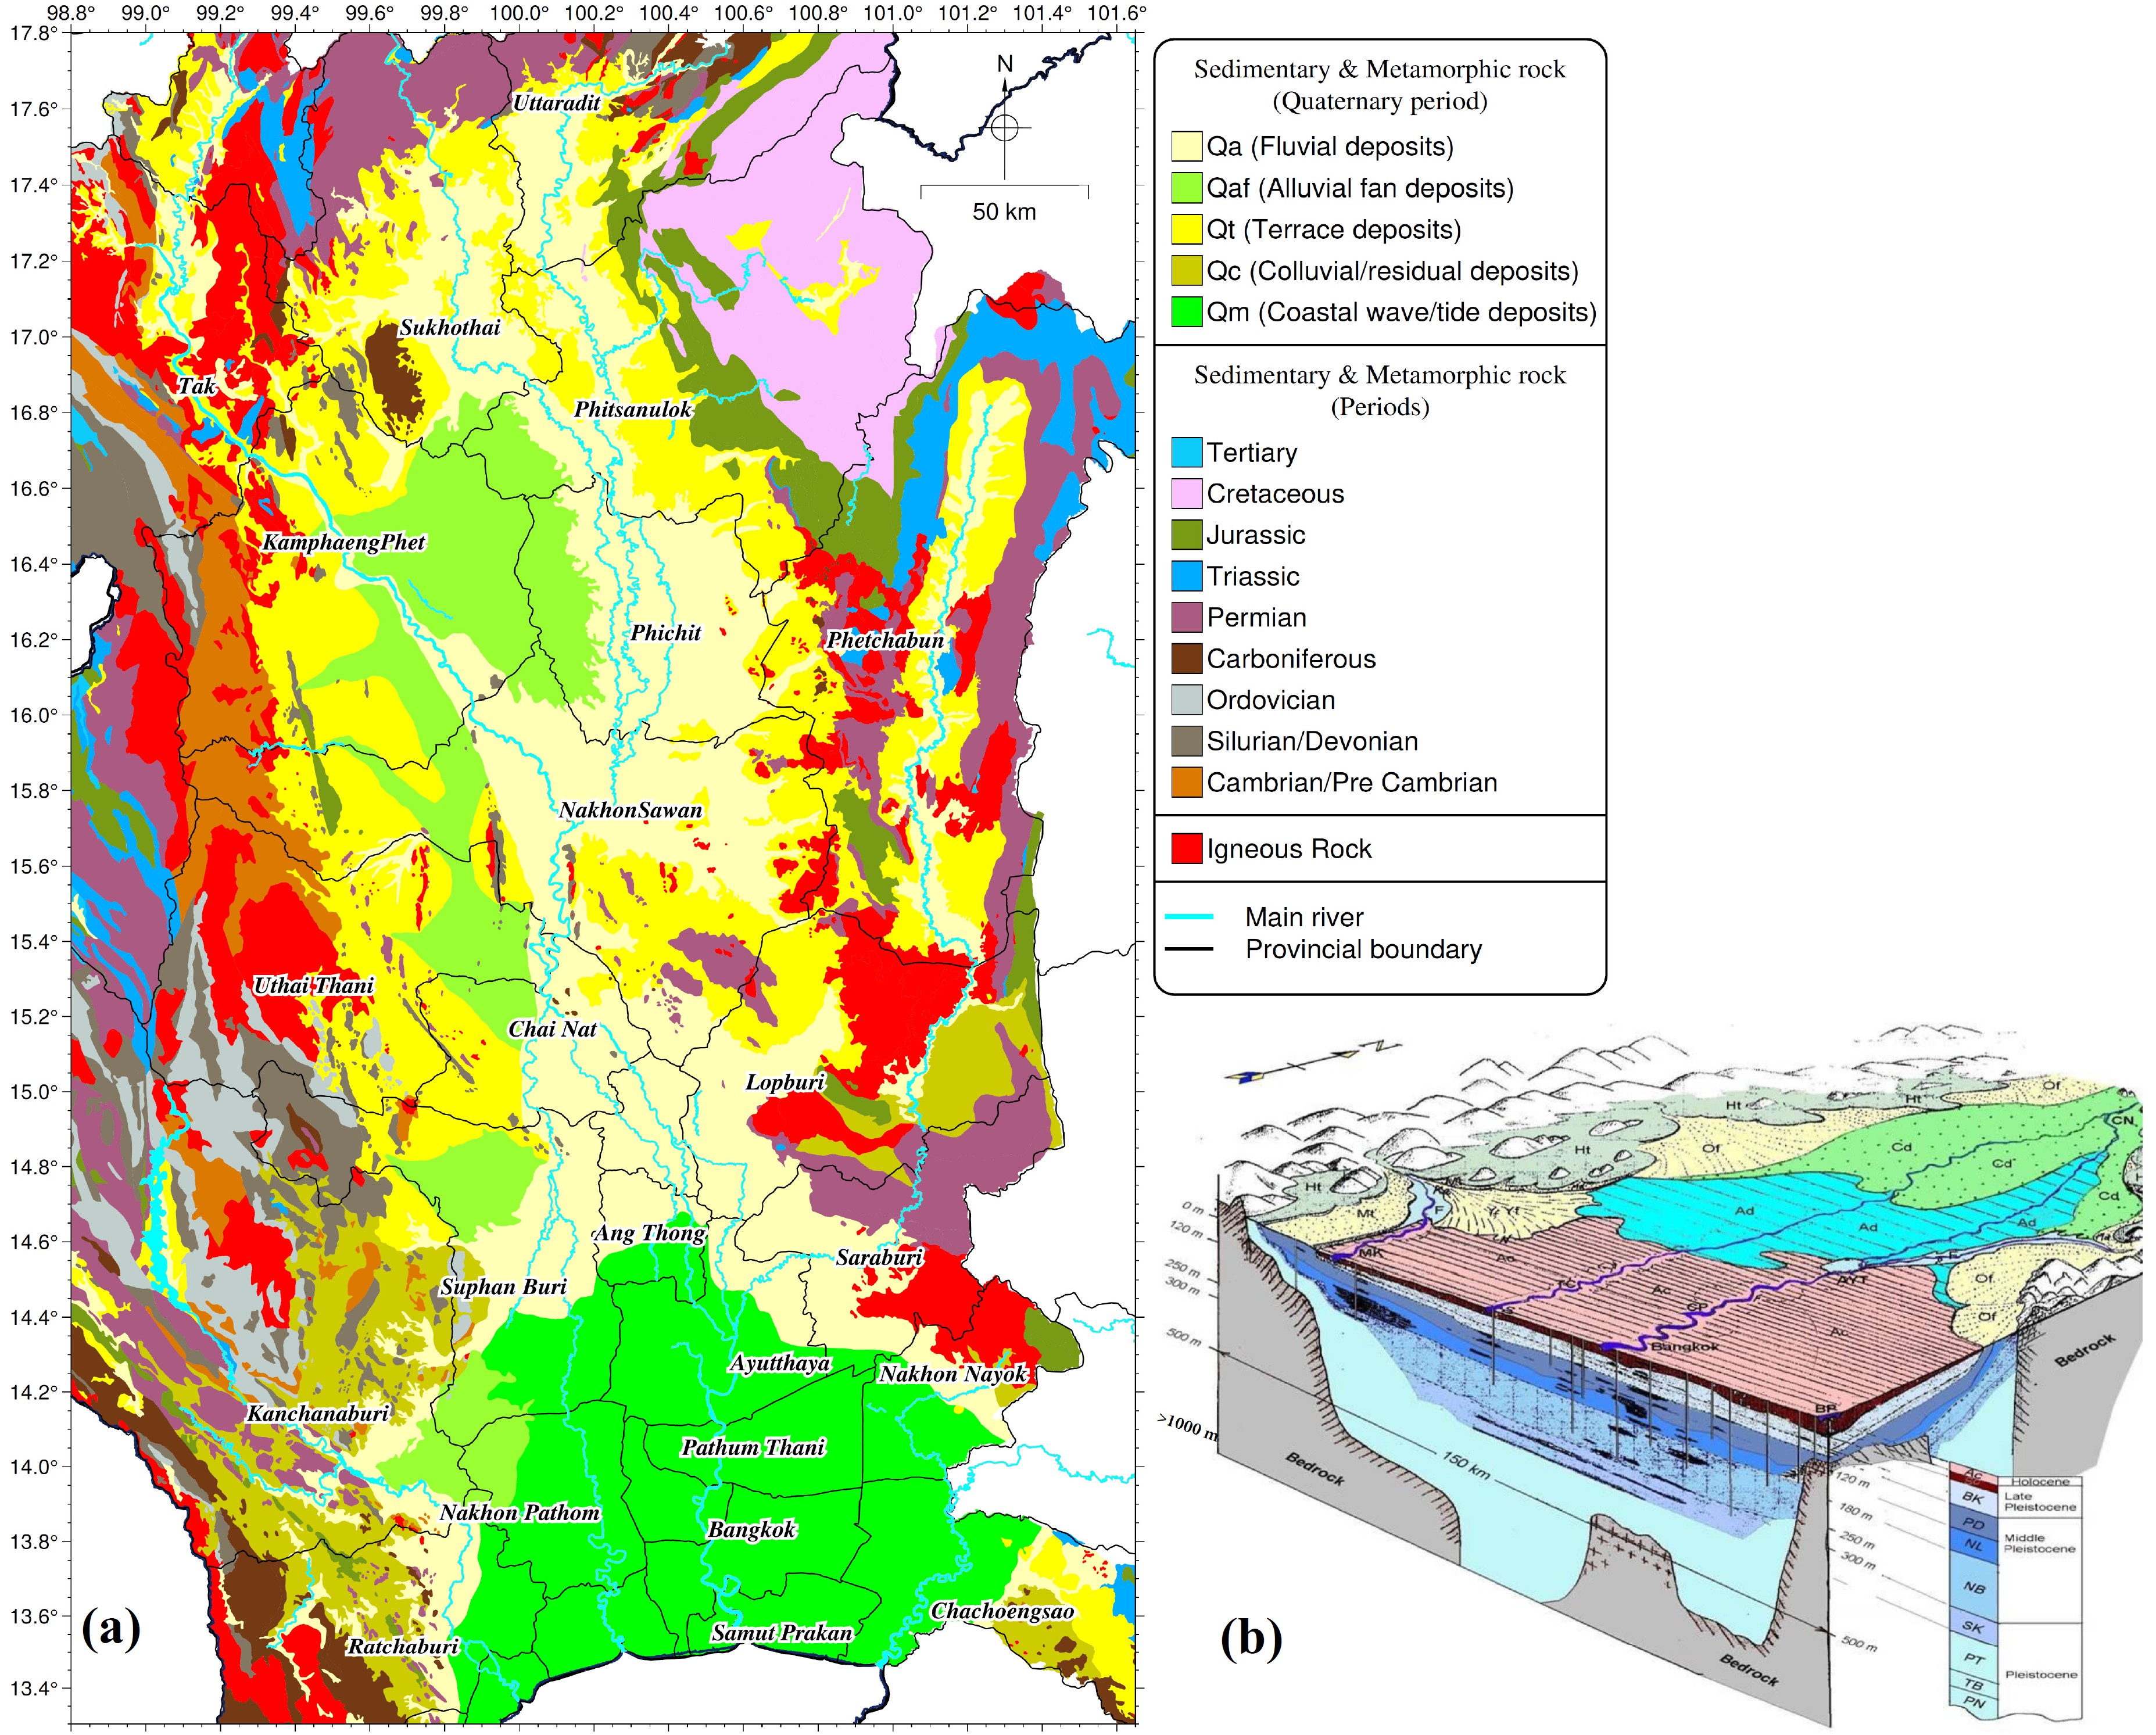 Figure 1 (a) Geologic map of central Thailand and the surrounding area; (b) Cross-section showing the sedimentary layers and depth of the bedrock in the lower central plain (4, 5). 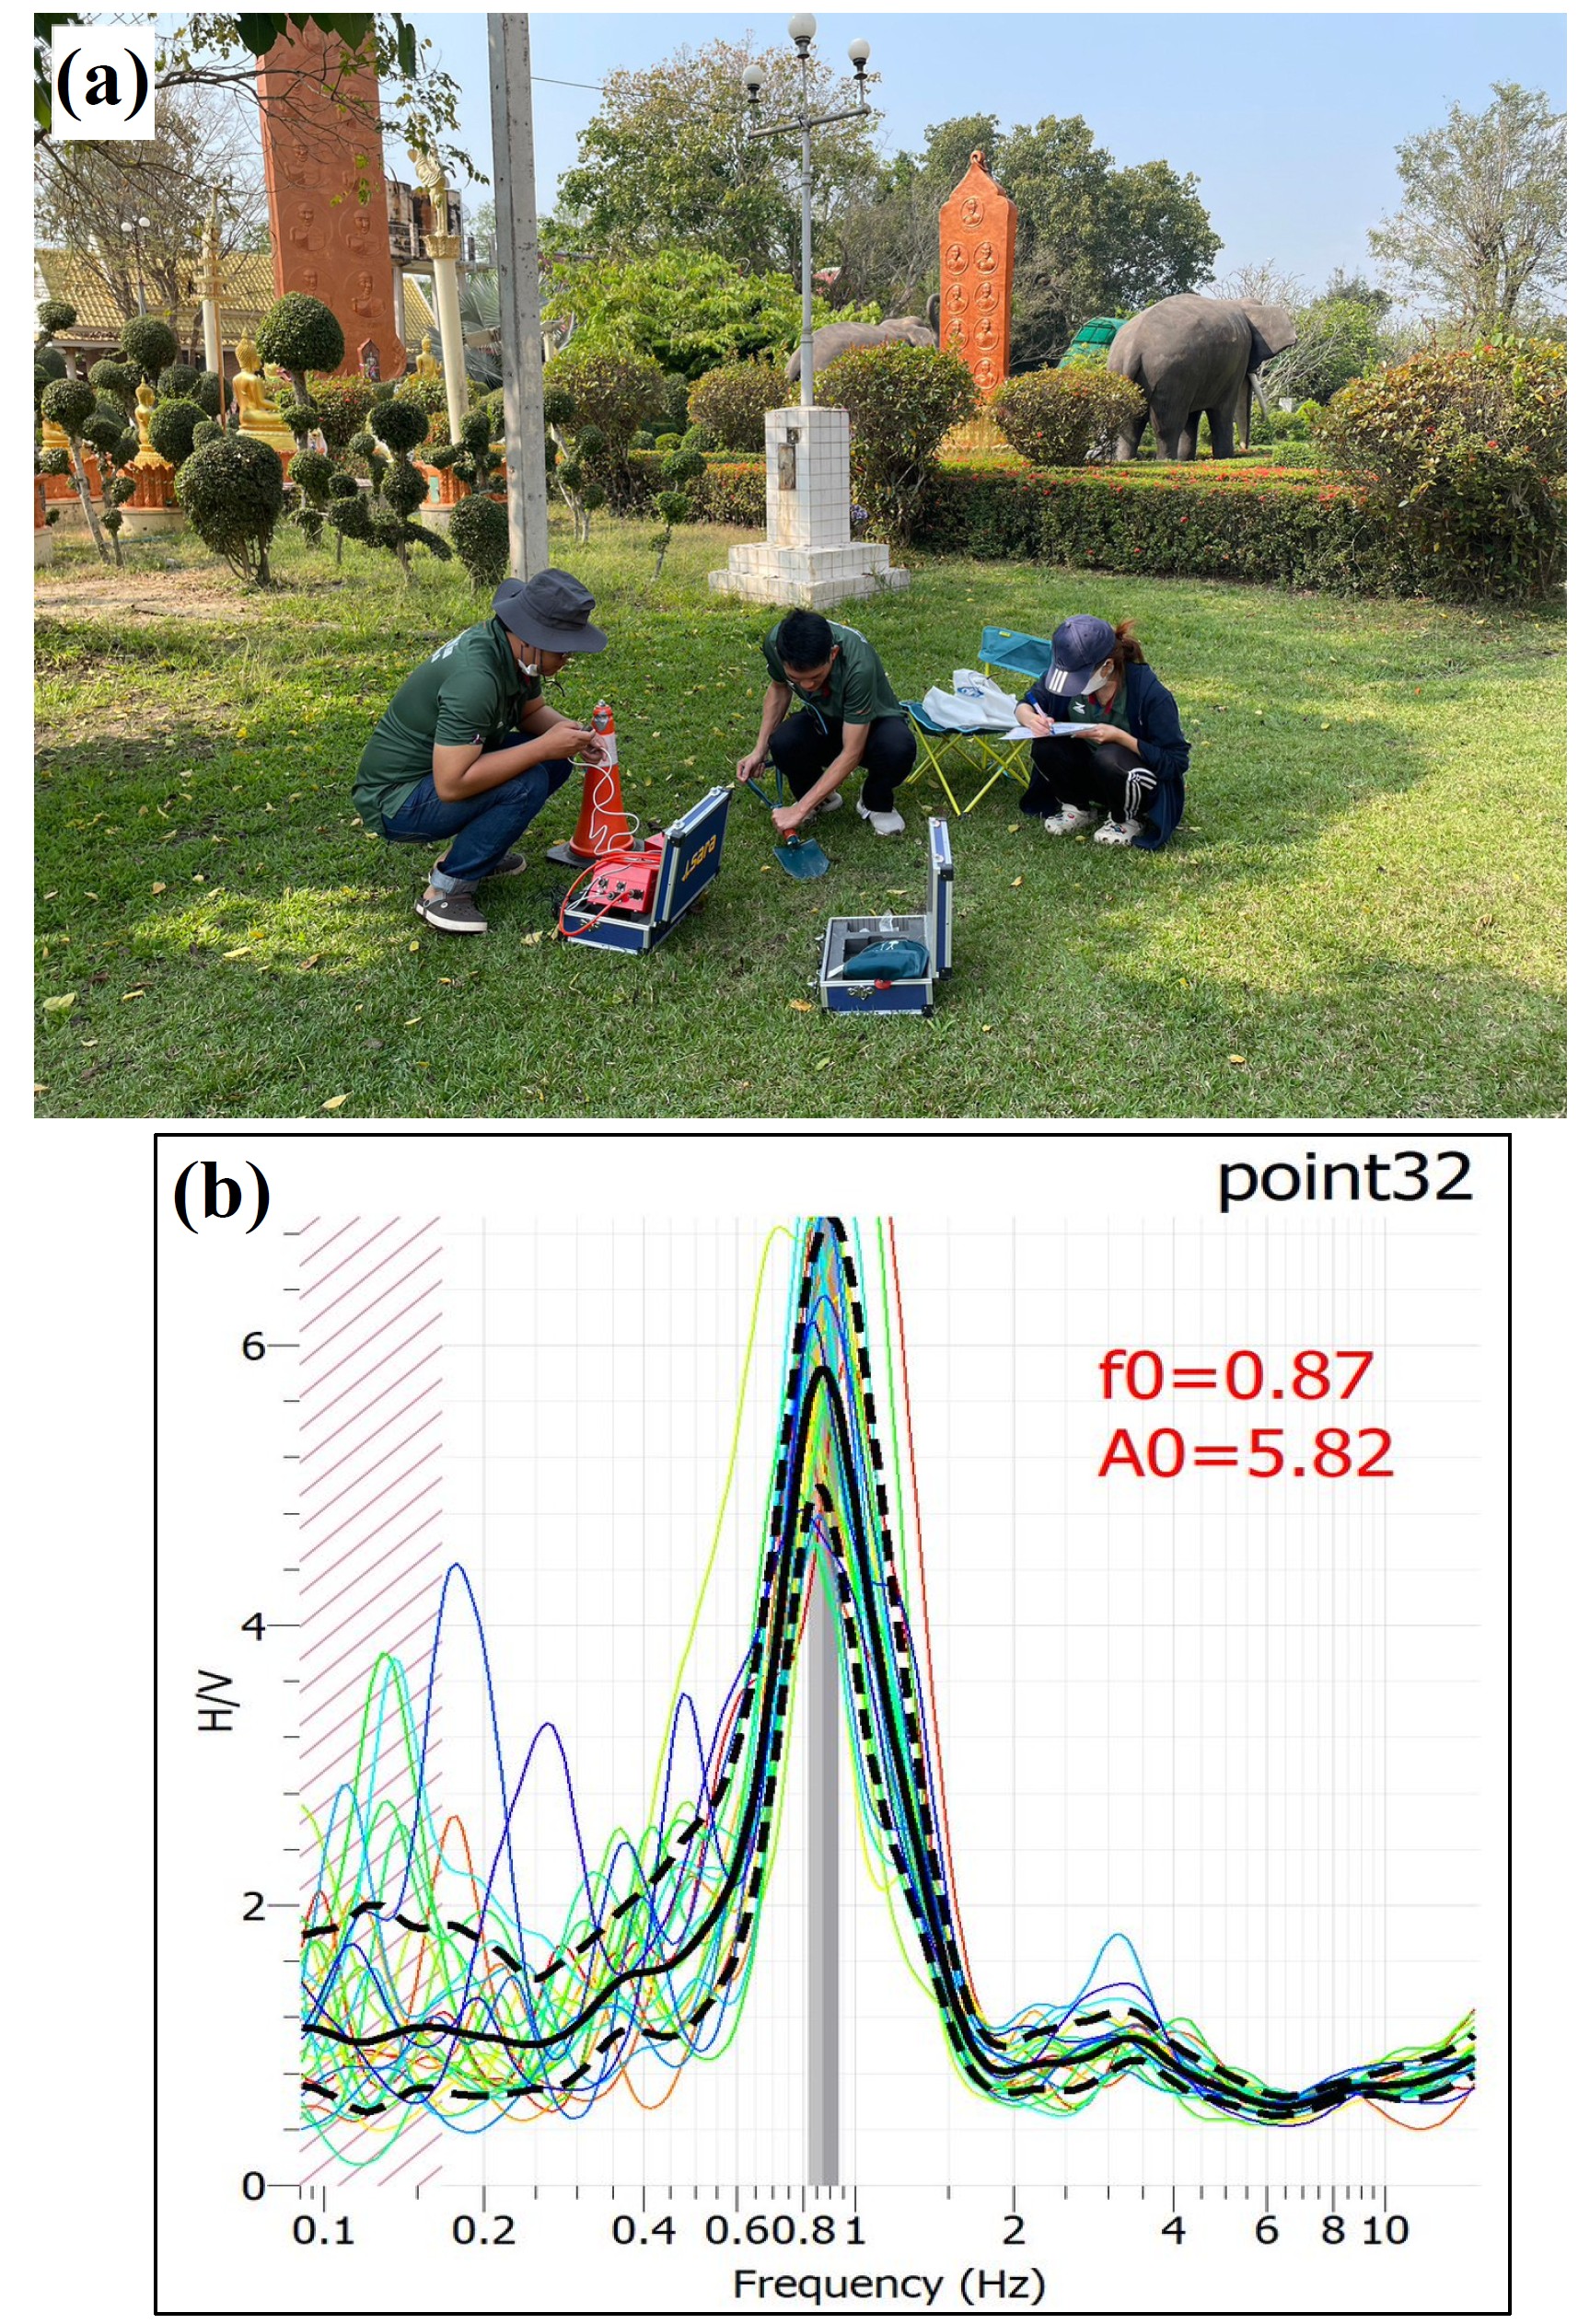 Figure 2 (a) Installation of equipment in the field at survey point 32, located in the vicinity of Wat Kaew Sriwilai, Sai Thong Watthana District, Kamphaeng Phet; (b) Analysis of HVSR for point 32, revealing the average HVSR curve denoted by the black solid. This curve indicates the fundamental frequency at 0.87 Hz and an HVSR amplification of 5.8. 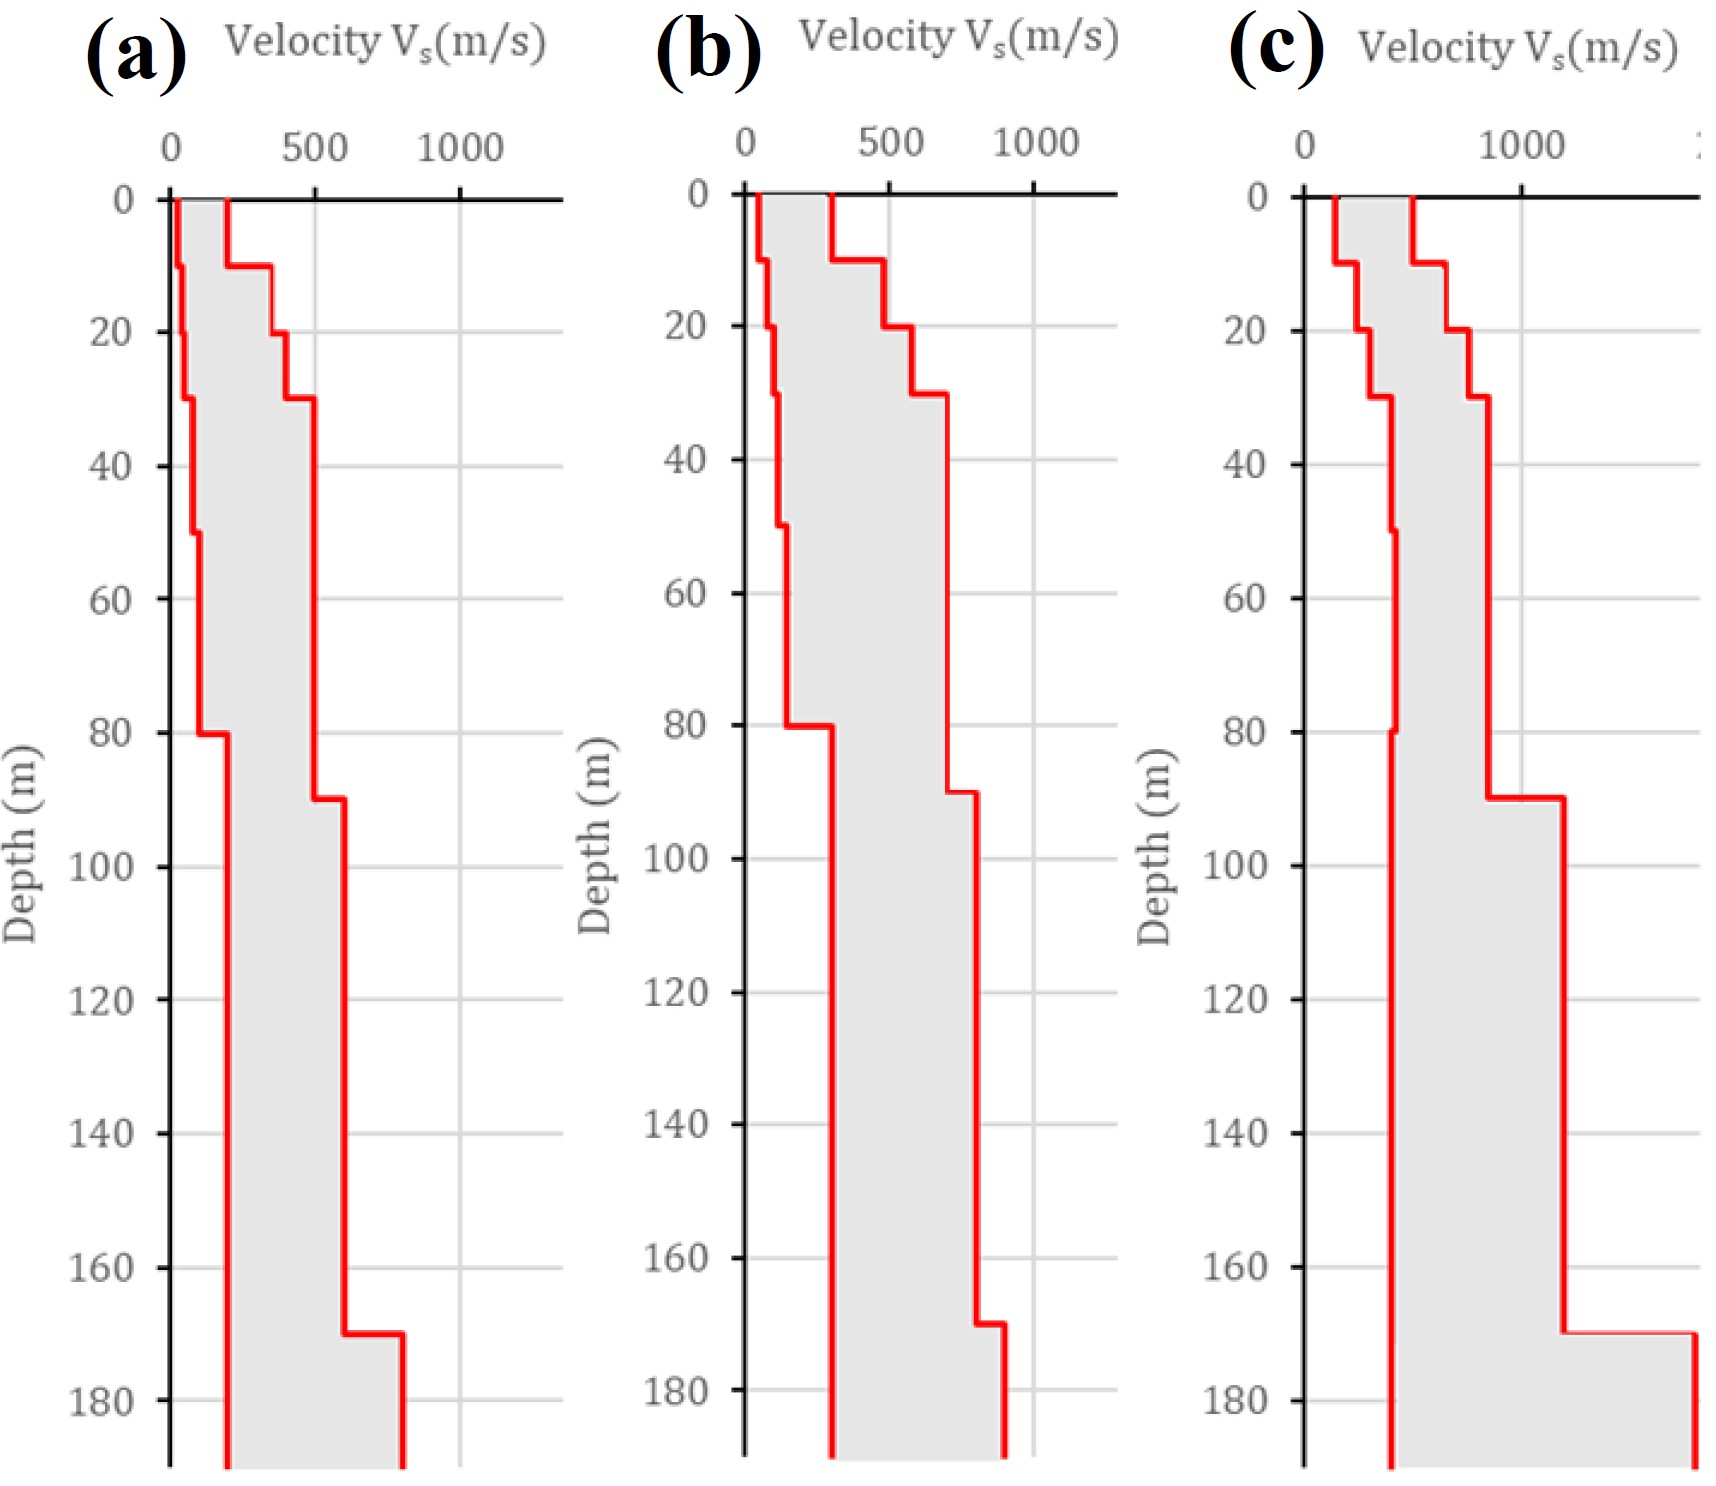 Figure 3 Some examples of the shear wave velocity model range used in the HVSR inversion for the fundamental frequency of the site, including (a) below 0.4Hz, (b) between 0.4Hz and 0.65Hz, and (c) above 3.0Hz, respectively. 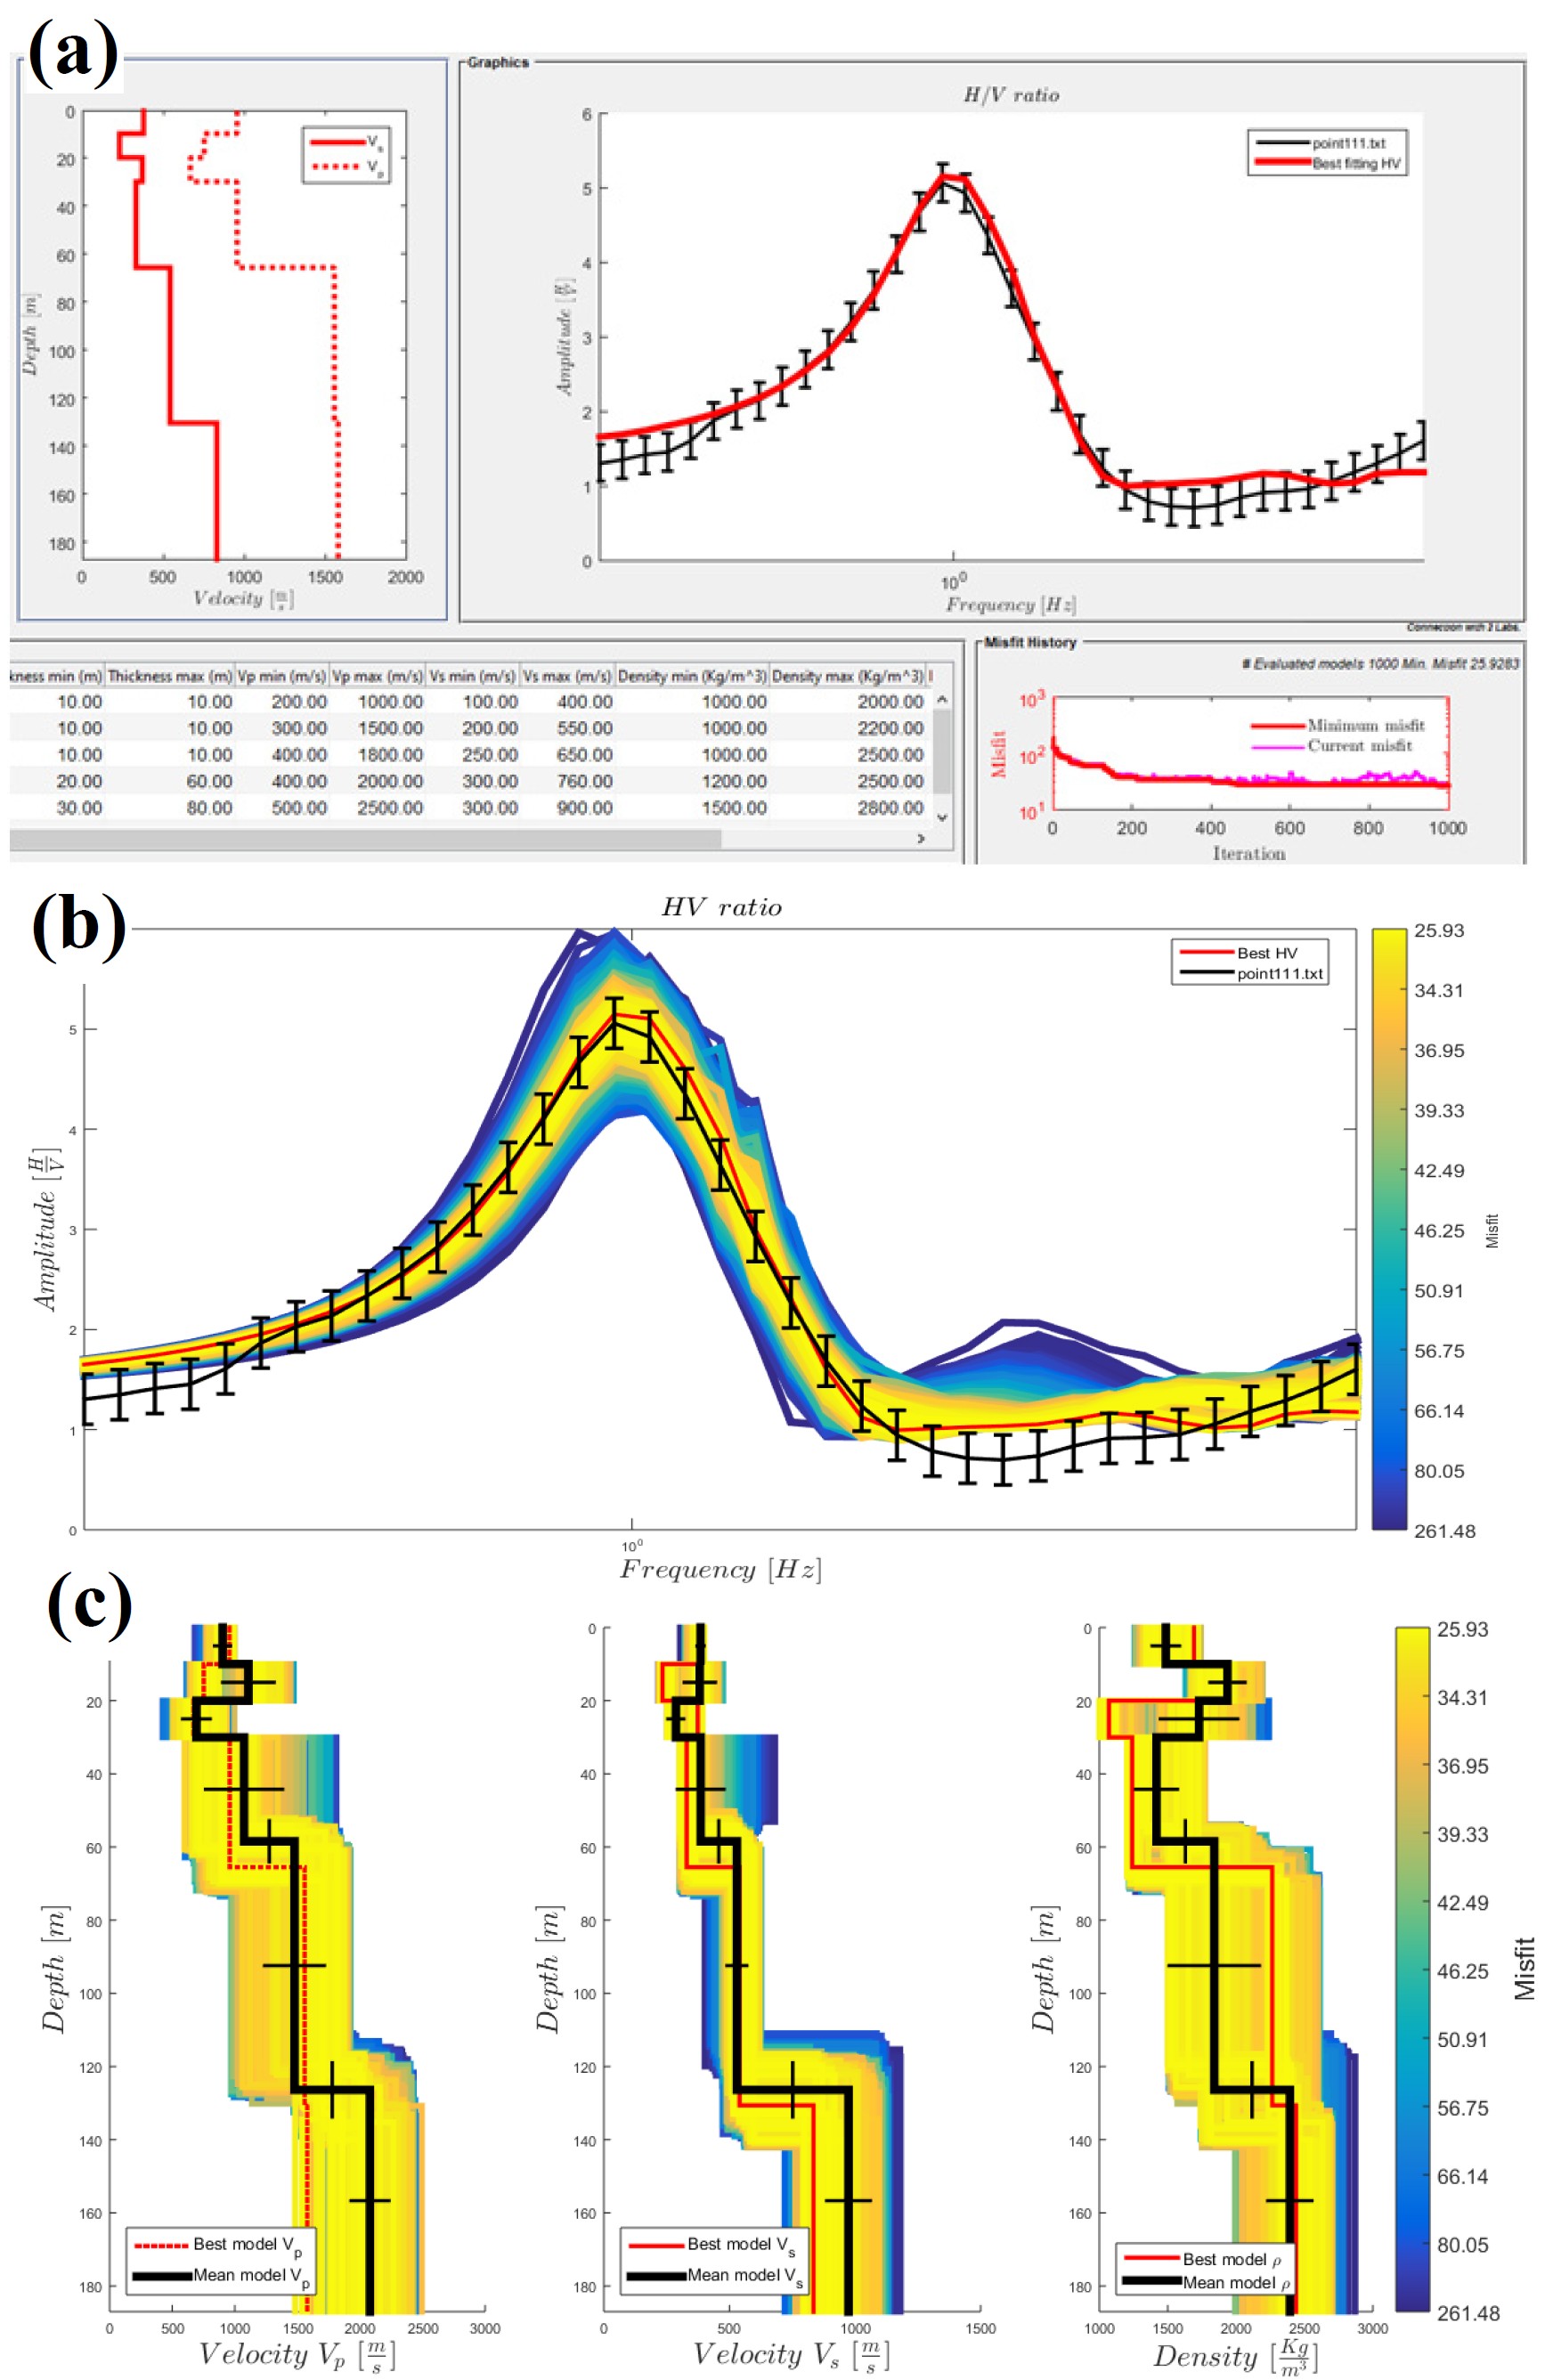 Figure 4 (a) The best fitting model from inversion of the HVSR curve (black lines) for survey point 111 from 1000 iterations; (b) The observed HVSR curve and the modeled HVSR curves (color lines); (c) The inverted Vp, Vs and density profile.  Figure 5 A map of the fundamental resonance frequency of sediment deposits in the central plain, Thailand derived from HVSR curves. The topography around the basin includes active faults and 149 microtremor measurement sites.  Figure 6 A map of the average shear wave velocity of the top 30 m of the subsurface is derived from HVSR inversion.  Figure 7 A soil classification map of the central plain in Thailand categorized according to the NEHRP classification.  Figure 8 Seismicity map of Thailand and surrounding areas used in seismic hazard analysis, which comprises earthquake catalogue obtained from the USGS-NEIC (M>5, during 1922 – 2023) of subduction earthquake (gray) and TMD earthquake catalogue between 2007-2023 (red).  Figure 9 PSHA map for PGA at 2475-year return period on Vs30 site condition.  Figure 10 PSHA map for 0.2-sec spectrum acceleration at 2475-year return period on Vs30 site conditions.  Figure 11 PSHA map for 1.0-sec spectrum acceleration at 2475-year return period on Vs30 site conditions. |